

Table of Contents
Weekly Activity Summary
The Weekly Activity Summary is an email that tells you what happened on your accounts over the previous week: how many events there were, what the cameras detected, when and where it happened, how the team responded, and how well the cameras and TetherBoxes stayed online. It arrives every Monday morning, covering Monday to Sunday of the week before.
It is off by default. It is available to administrators, integrators, distributors and TetherX staff. Each person switches it on for themselves in their notification settings, and receives one email for each account they have access to. Where someone is limited to some sites, the summary covers those sites and nothing else.
The Health Report lists what needs fixing. The Weekly Activity Summary describes what the system saw and did, and each figure is compared with the week before so a change stands out.
When the Figures Begin
The summary counts events as they happen, starting from the day the feature was introduced on your account. Nothing before that day was counted, so:
- A week that began before counting started shows Event counting had not begun this week instead of its event figures.
- The first week counted part-way through says Counting began on that date, and its figures cover only the days since.
- Weeks before counting began are left out of the charts and comparisons. They are not shown as zero, because nobody knows what happened in them.
Camera availability and recording hours started being tracked separately. Until they cover a full week, those sections say Availability tracking starts with the next full week and Recording tracking starts with the next full week.
Tip: Every day in the summary is the site's own local day, from midnight to midnight on the site's clock. If you are in a different time zone from your sites, the days will not line up with your own midnight.
Headline Tiles
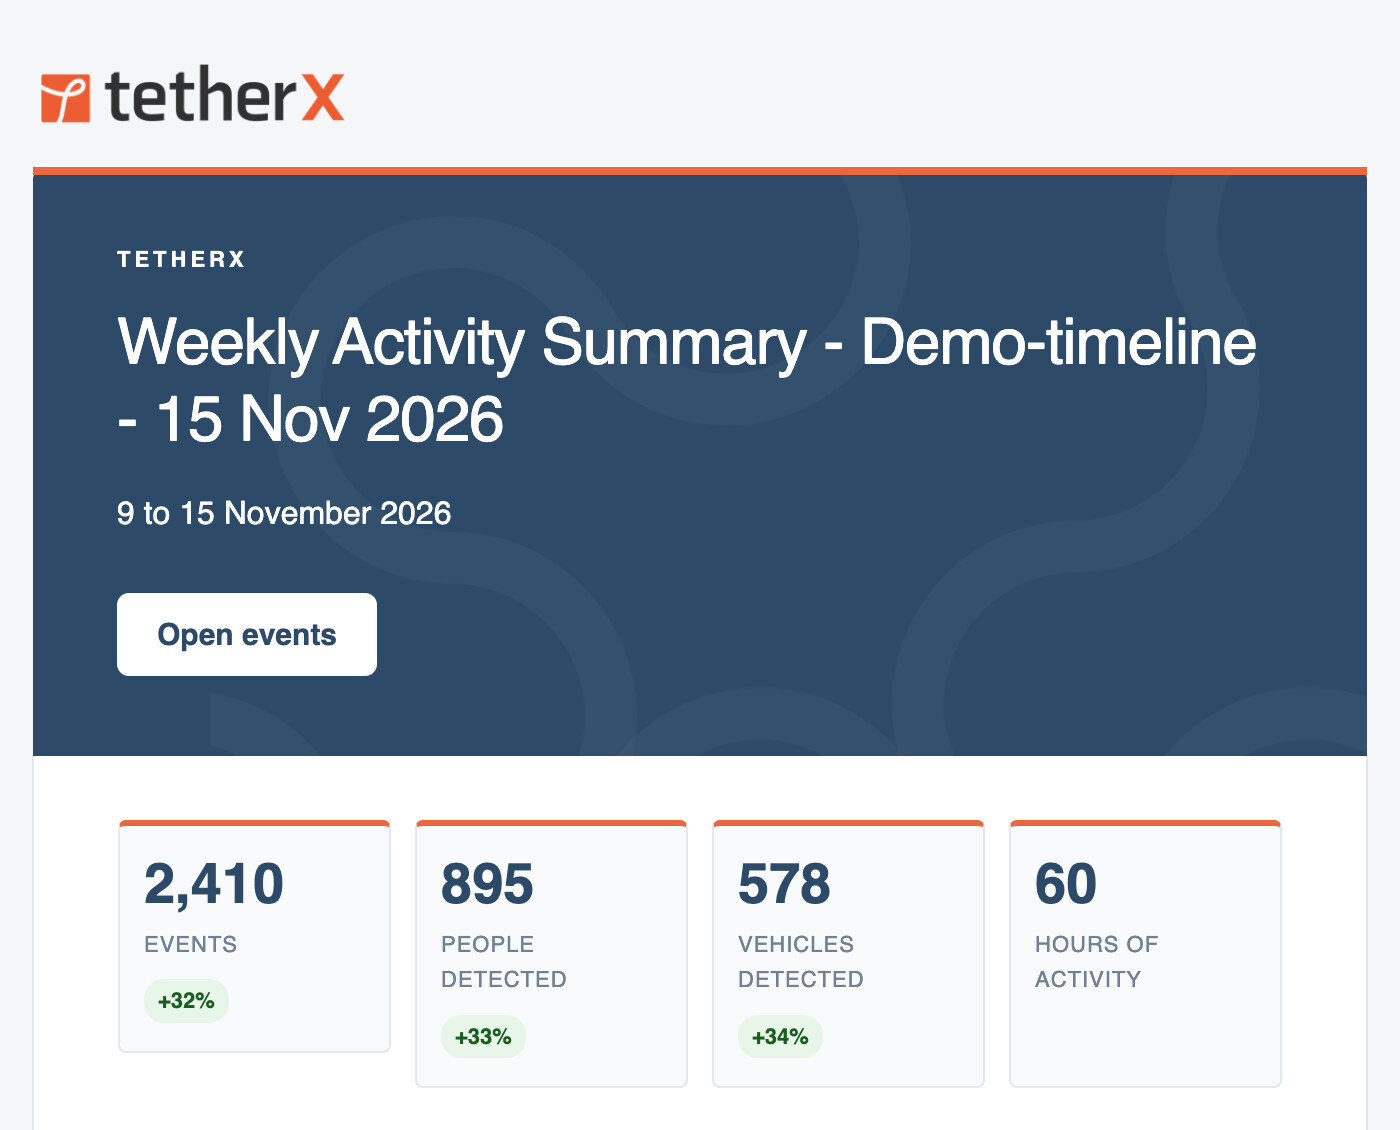
Four tiles open the summary:
| Tile | What it counts |
|---|---|
| Events | Every event on the account this week |
| People detected | Events in which a person was detected |
| Vehicles detected | Events in which a vehicle was detected |
| Hours of activity | The combined length of this week's events |
The green or red badge under a tile is the change against last week. There is no badge when last week had nothing to compare with or was not counted.
When this week is far from normal, a sentence under the tiles says so, for example People were up 60% on a normal week: 400 events against an average of 250 over the previous four weeks. A normal week is the average of the four weeks before this one, leaving out any that were not counted. A sentence only appears for a change of at least 50% and at least 10 events, and the summary shows no more than two of them.
Outside Monitored Hours
This section depends on whether your sites have a monitoring schedule:
- Sites with professional monitoring - events are split into those that happened while the site was monitored and those that happened while monitoring was off, with the reason, such as out of hours. See Monitored Hours.
- Sites without a monitoring schedule - the summary counts the events that happened overnight, between 22:00 and 06:00 on the site's clock. These are the hours of the night, not hours that a schedule left without monitoring.
When an account has both kinds of site, each event is counted once, under the kind of site it happened on.
Week by Week
A bar for each of the last six weeks shows how many events there were, with this week highlighted. Weeks before counting began are not drawn.
When It Happened
The section opens with the busiest day and the hour of the day when the most events started.
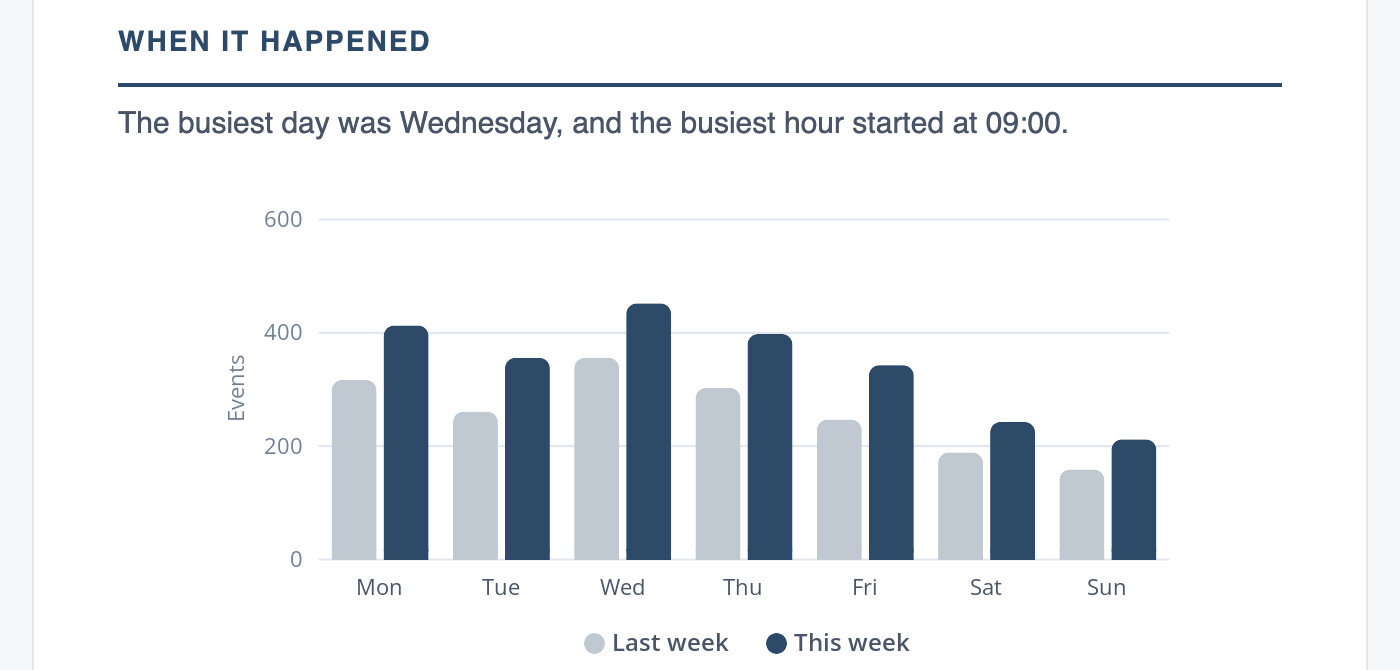
- Events by day - a column for each day from Monday to Sunday. The lighter column is last week and the darker one is this week. Last week is left out when it was not counted.
- Events by hour of the day - a strip of 24 squares from midnight on the left to 23:00 on the right. The darker a square, the more events started in that hour.
- People detected by day - a circle for each day, last week above and this week below. A larger circle means more events with a person in them, and the number is printed under each one.
What Was Detected
A table of up to eight kinds of detection seen this week, such as people, cars or faces, with the number of events for each, most frequent first. Plain movement with nothing recognised in it is counted in the Events tile but not listed here.
The Against last week column shows the change for each kind. New means it was detected this week and not at all last week.
Where
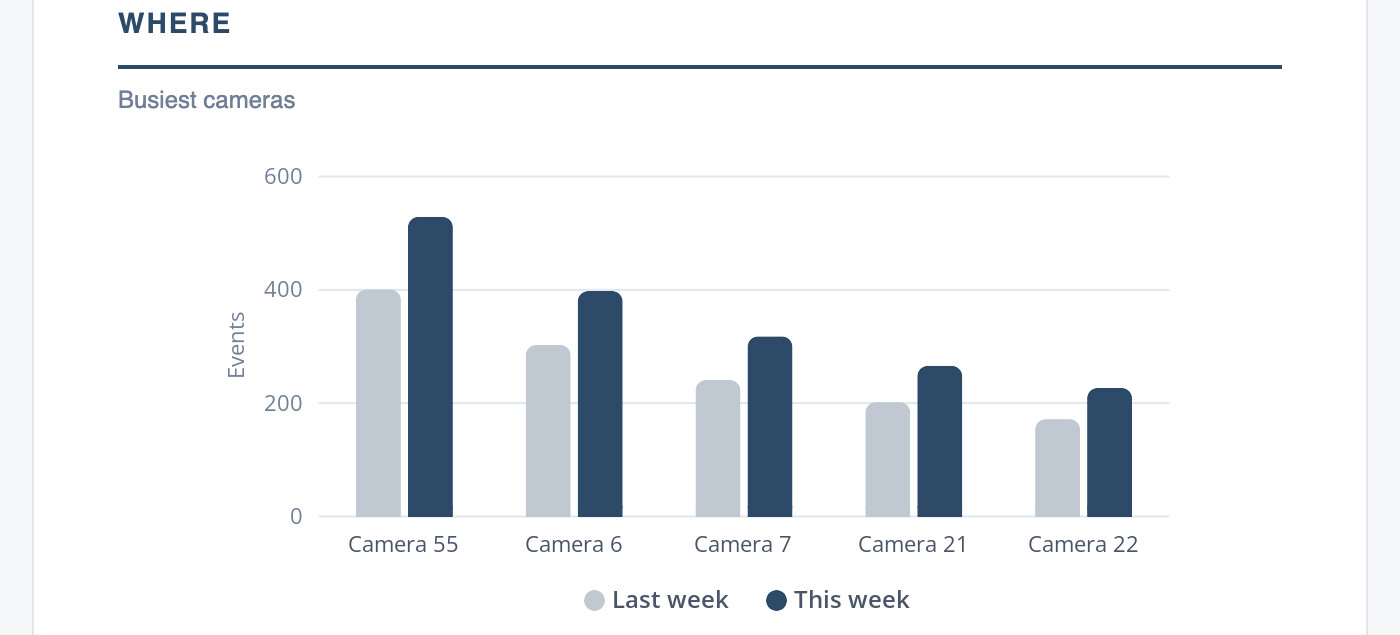
- Busiest cameras - the five cameras with the most events this week, each beside its figure for last week.
- Busiest sites - the same for your sites. This chart only appears when the account has events on two or more sites.
Response
This section shows what your team did with the week's events. It only appears when at least one event was closed, flagged, shared or had emergency services dispatched.
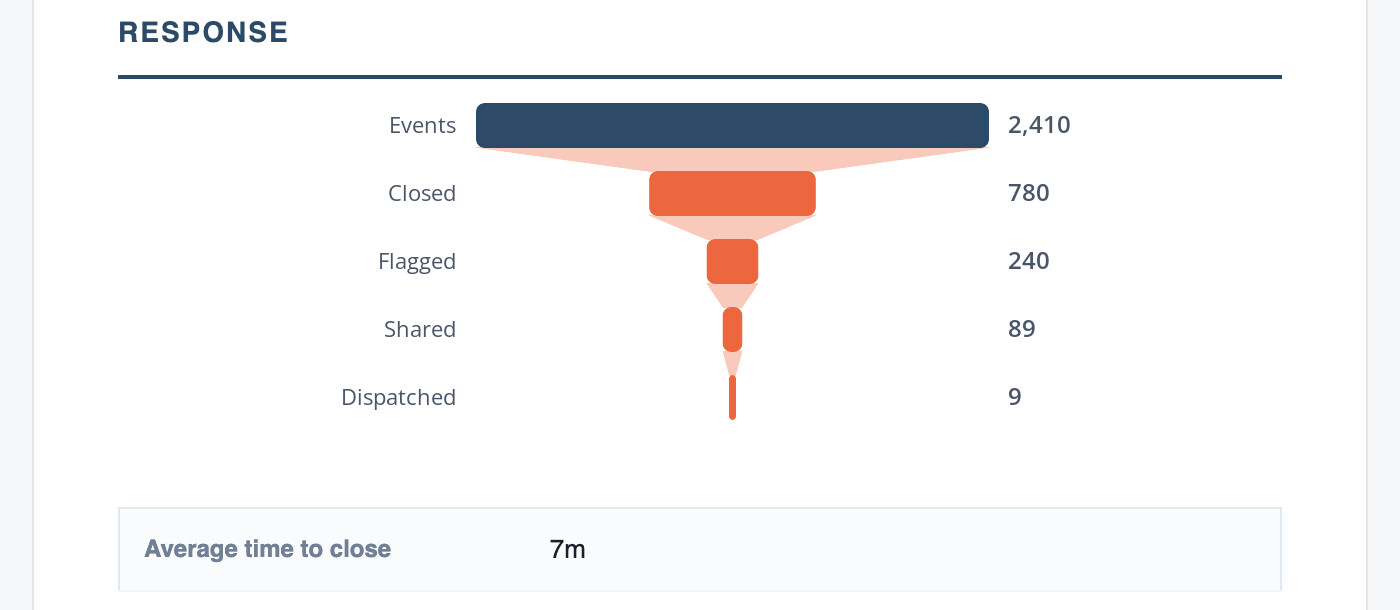
| Stage | Meaning |
|---|---|
| Events | Every event this week, the top of the funnel |
| Closed | Events that were closed |
| Flagged | Events that were flagged |
| Shared | Events that were shared |
| Dispatched | Events where emergency services were dispatched |
A stage only appears when it happened at least once. Average time to close is the average time from the start of an event to when it was closed.
System Health
The section opens with the share of the week your cameras were available, for example Cameras were available 98.3% of the time this week.
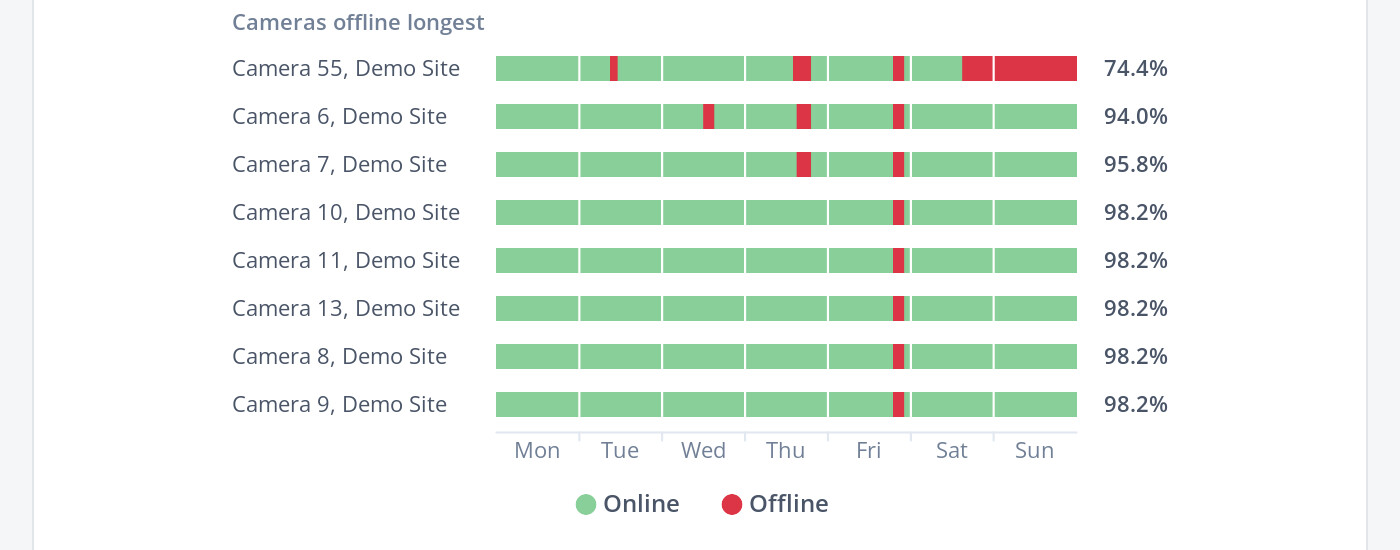
The uptime strip draws the week from Monday on the left to Sunday on the right:
- Green - online.
- Red - offline.
- Grey - not yet tracked. This appears in the first week of tracking, for the time before it began.
The strip lists up to eight of your sites and up to eight cameras that were offline longest, each with the percentage of the week it was online. A site counts as offline while its TetherBox is offline. A camera counts as offline while it is offline itself or while its TetherBox is, because nothing can be recorded from it during that time.
Warning: A TetherBox outage takes every camera behind it offline in the summary, so one unit losing power or its Internet connection can lower the availability of a whole site.
Under Right now, the summary shows the state of the system when the email was written: cameras online, the number of sites and TetherBoxes, and the shortest recording retention across your online TetherBoxes. That last figure is how far back you can look on the TetherBox that keeps the least. Cameras that are offline at that moment are listed with when they were last seen.
Team Activity
| Row | What it counts |
|---|---|
| Sign-ins | Times anyone signed in to the account this week |
| People who signed in | Different people among those sign-ins |
| Cameras watched live | Cameras somebody watched in Live View |
| Hours of camera time watched live | Time spent watching, added up per camera, so a wall of four cameras for one hour counts as four hours |
| People watching live | Different people who watched live |
| Automation runs | Times an automation ran |
The live viewing rows only appear when Live View Audit Logging is switched on in your account settings, because otherwise live viewing is not recorded. The automation rows, and the Most active automation rules chart, appear when you have access to automations.
Security
This section only appears when something happened during the week.
- Alarm panel - how many times the alarm panel was armed, disarmed and in alarm, followed by a line for each day with the first time it was armed and the last time it was disarmed.
- Deterrents - how many times a deterrent button was pressed, on how many cameras and by how many people, and how many times automations fired a deterrent.
Number Plates
On accounts with ANPR cameras, this section shows how many number plates were read, how many were entering and how many were leaving. Plates whose direction is not known, and plates on your block list, have their own rows when there were any. The section is left out when no plate was read.
Recording
Hours recorded this week adds up the recording time of all your cameras.
Cameras set to record continuously are expected to record all day, so they also get Share of the week continuously recording cameras recorded. Any of them that recorded less than 95% of the week are listed with their hours and percentage, lowest first. Cameras that record around events only get the hours figure, because a short total is normal for them.
When Images Are Blocked
The charts are images inside the email. Many email programs block images until you allow them. Each chart carries a description listing every value it shows, so the figures can still be read, and screen readers read them out.
Configuring Your Summary
The summary is available to administrators, integrators, distributors and TetherX staff, and it is off until you switch it on:
- Click your profile icon (top-right) and select your profile.
- Open the Notifications tab.
- Under Weekly Activity Summary, switch on Send the Weekly Activity Summary.
- Click Update User.
The summary is not sent for a week in which an account had no events and has no cameras. To stop receiving it, switch the same setting off, or follow the link at the bottom of the email.
Tip: The Health Report can be sent on the same Monday and lists the faults behind any drop in availability.
Feedback
We'd love to hear how the Weekly Activity Summary is working for you. Leave a comment below.
Referenced in: