

Table of Contents
Health Report
The Health Report provides a snapshot of issues across your TetherBoxes, cameras, drives, monitored network devices, and active access control integrations. It can be configured to be sent daily, weekly, or monthly via your notification settings.
Tip: If you already operate an external HTTP uptime monitoring tool (Uptime Kuma, Uptime Robot, HetrixTools and similar), you can also feed TetherBox up/down status straight into it - see Uptime Monitoring.
The report is colour-coded so you can triage at a glance - red for critical, amber/orange for noteworthy, navy/blue for suggestions and monitored devices. Summary cards at the top show total issues, TetherBox issues, and Camera issues at a glance, and every issue links directly to the affected resource and to the relevant help article.
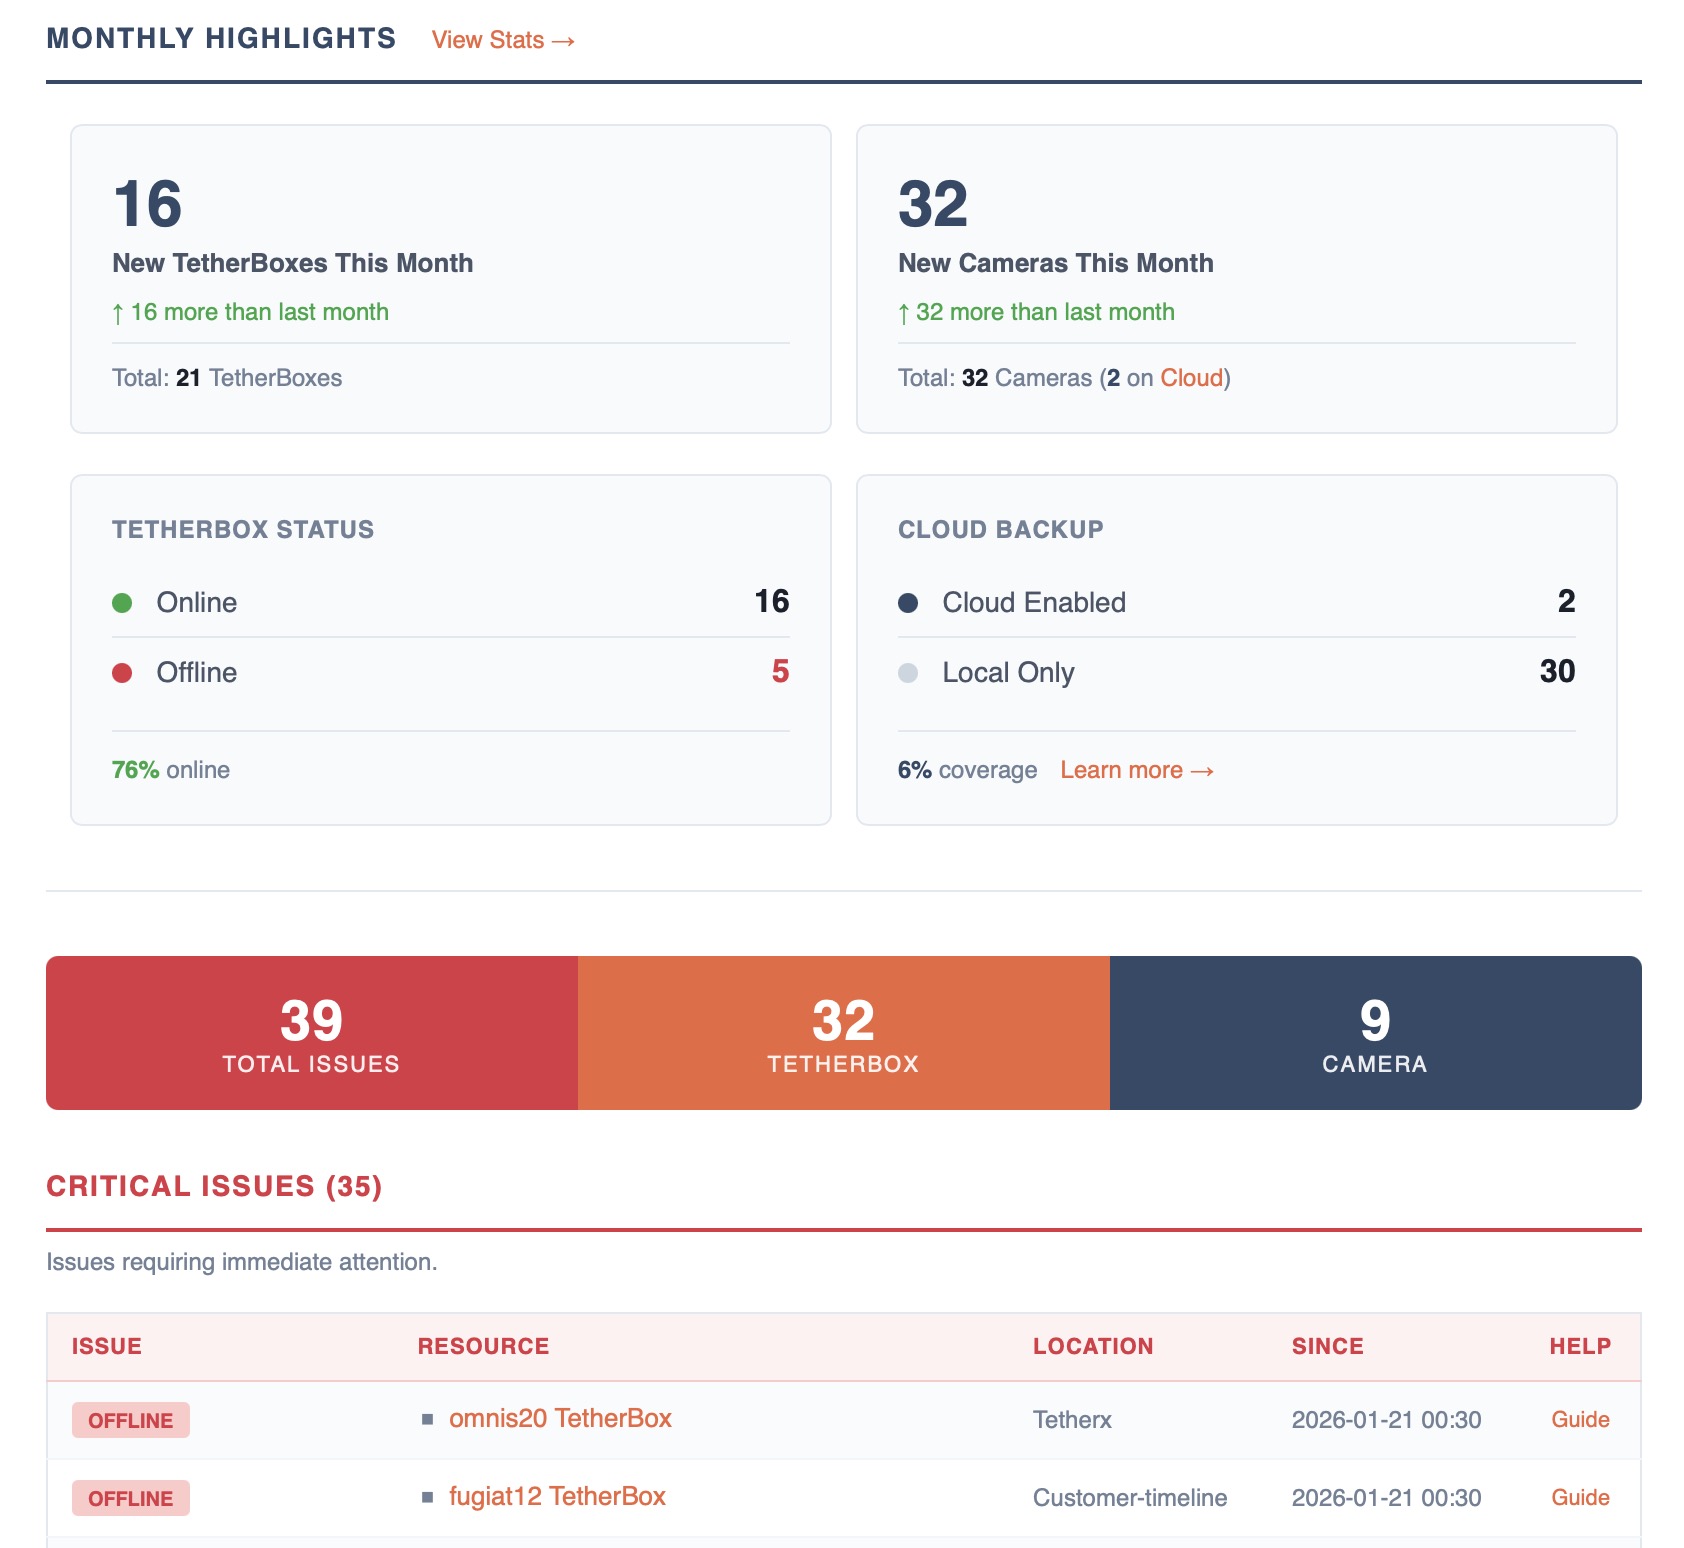
Issue Categories
Issues are organised into these categories:
- Critical (Red) - Requires immediate attention
- Noteworthy (Amber) - Worth monitoring
- Suggestions (Navy) - Recommendations for improvement
- Monitored Devices (Navy) - Network device issues
- Access Control Issues (Navy) - Active integrations with a reported connection, API or live-event listener problem. This category only appears when an integration has an issue.
Warning: When a TetherBox is offline, issues for its cameras, drives, and devices are not reported since the current state is unknown. Click the TetherBox name in the report to view the last known status.
Tip: To remove offline units you no longer manage from your reports, Factory Reset them.
Critical Issues
| Issue | Description | Action |
|---|---|---|
| OFFLINE | TetherBox hasn't communicated with servers | Check power, network, and Internet connection |
| UNRESPONSIVE | TetherBox shows online but no heartbeat in 8+ hours | Usually indicates hardware or software fault - contact support |
| FAULTY | Hardware fault confirmed by TetherX team | Contact support for replacement |
| STRESS FAILED | Failed stress test during activation | Review logs and retry; contact support if persistent |
| OVERHEATING | CPU temperature exceeds 80°C | Check ventilation or relocate unit |
| HIGH LOAD | CPU/memory usage critically high | Reduce cameras, lower bitrates, or upgrade hardware |
| LOW CAPACITY | Storage below 7 days | Add storage, reduce bitrates, or enable Cloud Backup |
| FOOTAGE GAPS | Stream interruptions causing recording gaps | Check firmware, cables, and PoE. See Footage Gaps |
| DRIVE OVERHEAT | Drive temperature exceeds safe limits | Improve ventilation |
| EJECTED | Drive disconnected or ejected by software | Reconnect or replace if faulty |
Noteworthy Issues
| Issue | Description | Action |
|---|---|---|
| REBOOTS | 2+ reboots in last 7 days | Install UPS for power stability |
| RECONNECTS | 5+ reconnects in last 7 days | Check Internet stability |
| PACKET LOSS | Network packets lost between camera and TetherBox | Check cables and switch ports |
| UNUSED | An attached drive has no mounted filesystem or reports zero bytes of capacity | Open the drive and TetherBox links to inspect storage. Check the connection and enclosure; reconnect or replace faulty storage. See Storage Hardware Recommendations. |
Tip: Packet loss can be a critical issue, but it typically causes Footage Gaps which are already shown in Critical Issues. We list it here separately to avoid duplicate entries while still highlighting the root cause.
Unused drives count as issues and can trigger a daily or weekly report. Every affected drive is listed with its TetherBox, site and capacity, the reason it is unused, any health findings such as read errors, and why it cannot be formatted where that applies. Offline drives, drives on offline TetherBoxes and reserved RAID members are excluded. The Unused Drives tab on the Health Dashboard uses the same check.
Stale Recordings
Cameras that haven't recorded in 72+ hours are listed in a separate informational section at the bottom of the report. These are not counted as issues because they often represent normal behaviour.
Tip: Cameras in low-activity areas like storage rooms, back corridors, or rarely-used spaces may have nothing to record when using motion-based recording. Analytics may also be disabled or misconfigured. Check whether the location typically sees regular activity before investigating.
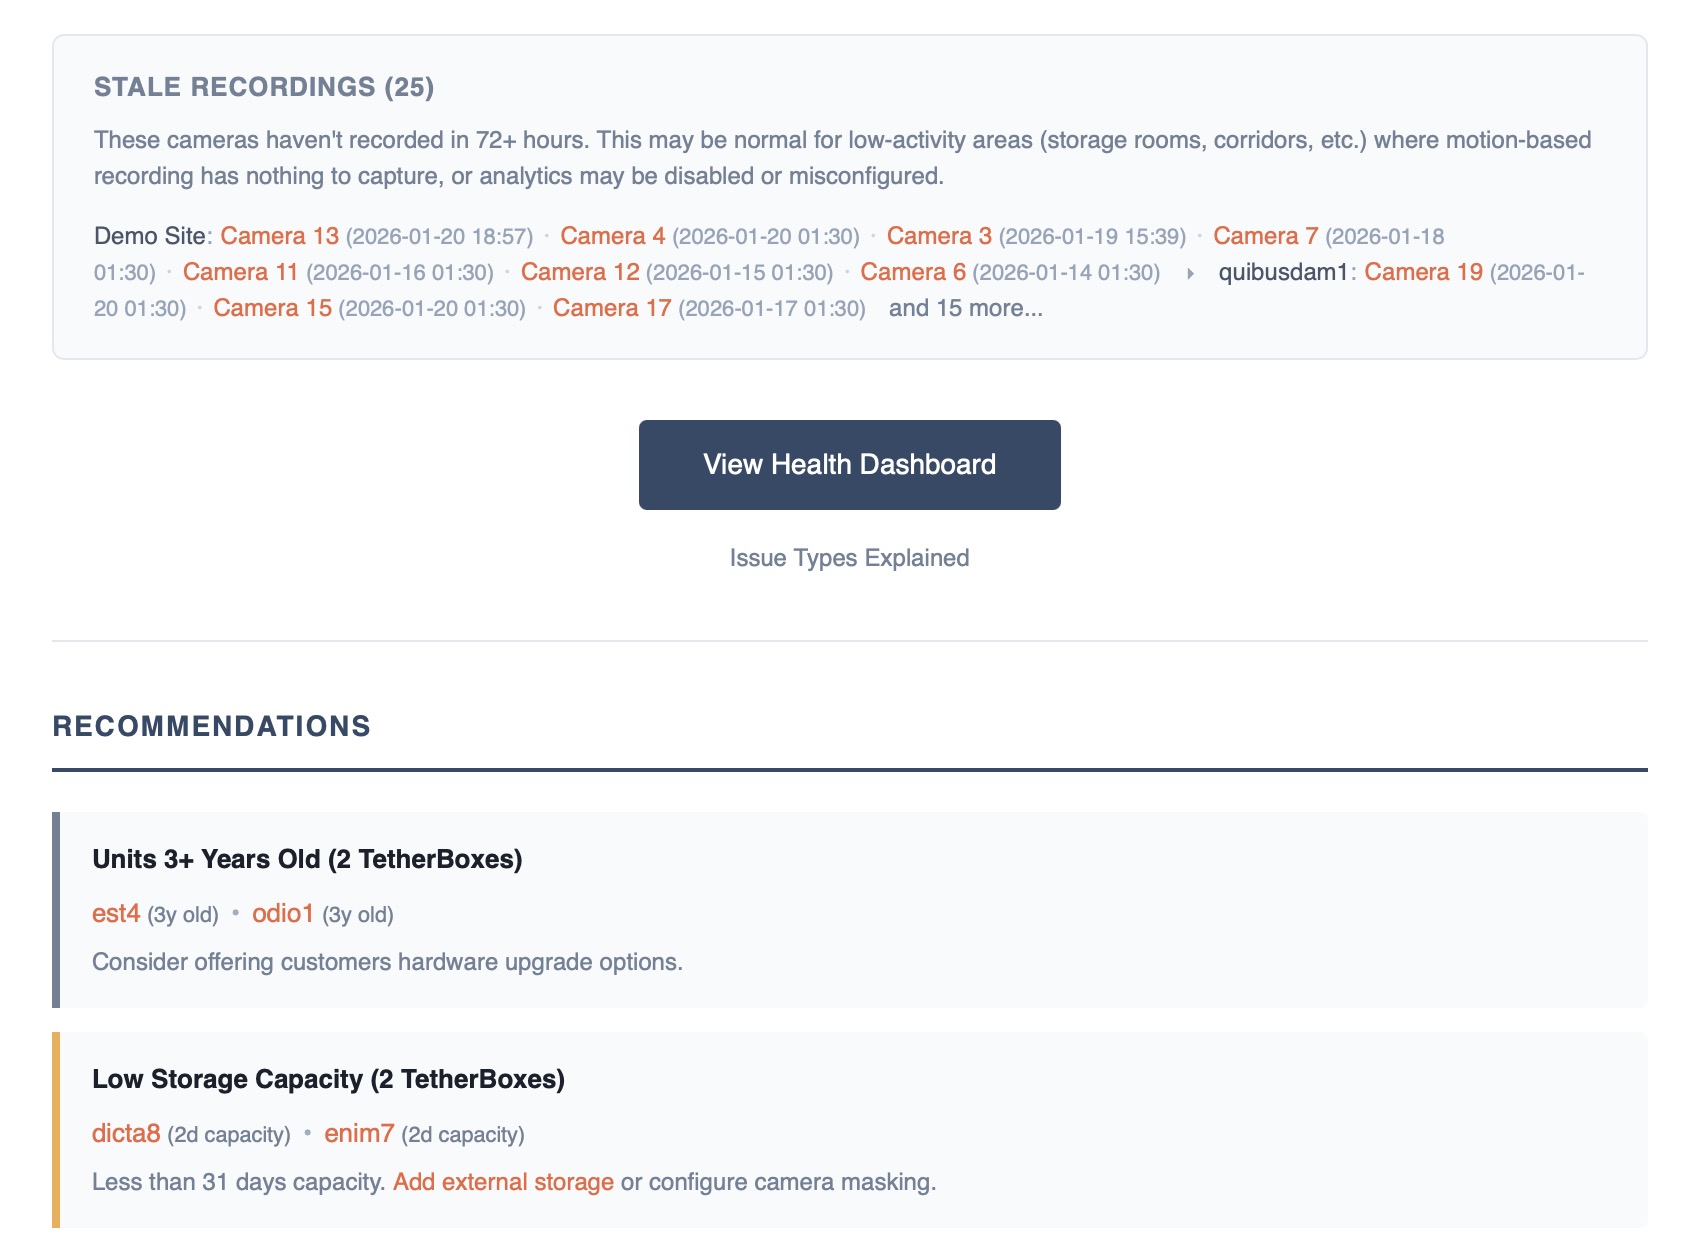
Suggestions
| Issue | Description | Action |
|---|---|---|
| HIGH BITRATE | Bitrate higher than recommended | Reduce in camera settings |
| INSUFFICIENT STORAGE | SSD is 128GB or less | Add external storage - see Storage Hardware Recommendations |
| AGEING HARDWARE | TetherBox is 3+ years old | Plan hardware refresh |
| INACTIVE ADMIN | Admin hasn't logged in for 12+ months | Review if account needed |
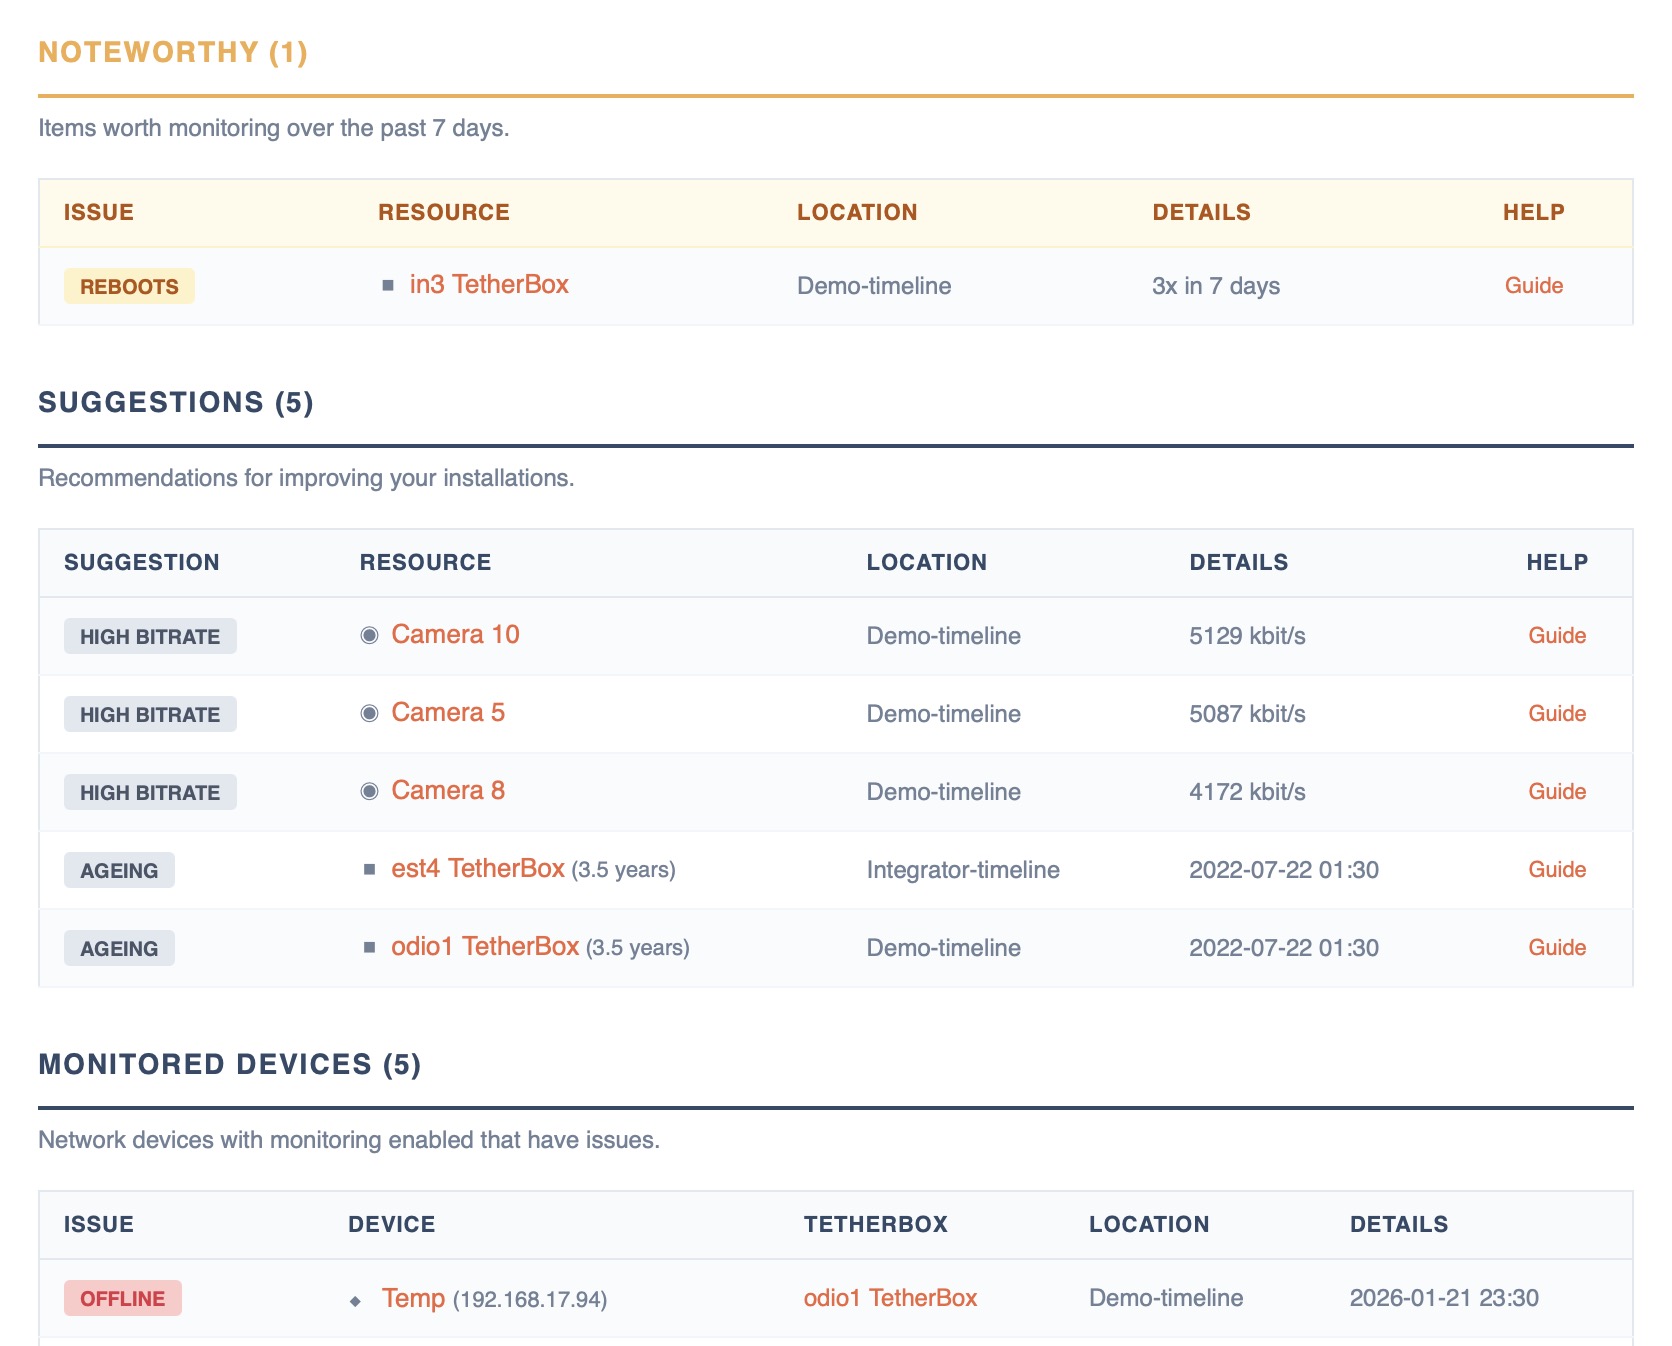
Monitored Devices
| Issue | Description | Action |
|---|---|---|
| OFFLINE | Device not responding to pings | Check power and network |
| PACKET LOSS | Device experiencing packet loss | Check cables and network congestion |
| STORAGE | A DVR or NVR reports a fault on one of its own disks | Replace the disk. The badge carries the recorder's own wording, such as hdd1: status error |
Note: A failed recorder disk counts towards Critical Issues even though it sits in this table, because the footage held on that disk is already at risk. The same recorders are listed under With failed storage on the Health Dashboard.
Access Control Issues
Only active integrations on sites you can access are included. Each affected system has one row with its TetherBox, site, an explanation, and links to the integration and Paxton troubleshooting guide. Simultaneous measured problems, such as an API fault and a stopped listener, are both explained in that row; the integration still counts as one issue.
| Issue | Meaning | Action |
|---|---|---|
| TetherBox offline | The TetherBox cannot report the PC, API or listener state | Restore the TetherBox connection first. The parent outage counts once under Critical Issues; affected access systems are listed here to explain the impact. |
| Integration configuration missing | The integration is enabled in TetherX but its local configuration is missing on the TetherBox | Contact support to restore configuration sync, then refresh the status. This does not mean the Paxton PC is offline. |
| Net2 API error | The PC's API returned an error | Check Enable LocalAPI, the API service and integration licence. A responding web page does not prove the API is working. |
| Net2 API connection refused | The connection to the configured API address and port was actively refused | Check that Net2 LocalAPI is running and listening on that port, then check the firewall. Refusal does not by itself mean the PC is offline. |
| Paxton network unreachable | The network reported that the configured API host could not be reached | Check the PC connection and IP address, VLAN, routing and firewall. This does not prove the PC is powered off. |
| Net2 API connection timed out | No connection completed before the timeout | Check power, network, API service and port, routing and firewall. A timeout cannot distinguish an offline PC from a blocked or unresponsive service. |
| Net2 API secure connection failed | The HTTPS connection failed | Check the configured HTTPS API port and Net2 API TLS configuration. |
| Live events unavailable | The API check reports a stopped or restarting listener | Check the listener on the TetherBox; a missing command or dependency needs repair. |
API and listener checks older than 24 hours, missing listener information, undated legacy online/offline flags, and checks unsupported by older TetherBox software are unverified. They appear in a neutral note, do not count as faults, and do not create the Access Control Issues category by themselves. They also prevent the report from claiming all systems are healthy. Open the integration and use Refresh status; older TetherBox software may need updating. Unverified status alone does not trigger a daily or weekly email.
Access control faults contribute to the Noteworthy summary count while keeping their own table. Disabled and verified working integrations are omitted.
Sort Order
Issues are sorted to surface the most relevant items first:
| Issue Type | Sort Order |
|---|---|
| Offline / Unresponsive | Most recently seen first |
| Overheating | Hottest first |
| High Load | Highest load first |
| Low Capacity | Lowest capacity first |
| Reboots / Reconnects | Most occurrences first |
| Camera Errors | Most recently updated first |
| Footage Gaps | Most restarts first |
| Stale Recordings | Most recently recorded first |
| Packet Loss | Highest loss percentage first |
| Ageing Hardware | Oldest first |
| Inactive Admins | Longest inactive first |
Configuring Your Report
You can change the frequency or disable the Health Report in your notification settings.
Tip: The Health Dashboard provides a real-time view of all issues and allows filtering by timeline.
Feedback
We'd love to hear how the Health Report is working for you. Reply directly to the email or leave a comment below.
Referenced in:
- Monitor vs Record Mode
- ARC Performance Reports
- Audit Log
- Frequently Asked Questions
- Getting Started with TetherX
- Health Dashboard
- Questions to Ask Your Security System Supplier
- Support Access
- User Guide
- Uptime Monitoring
- Notifications
- Push Notifications
- Factory Reset
- TetherBox
- TetherBox Troubleshooting